In the world of digital marketing, knowing what’s working and what’s not, can mean the difference between slow growth and steady success. But here’s the thing: most businesses collect website reporting data. Few act on it.
That’s where website reporting comes in. Done right, it’s more than just monthly charts and keyword lists. Reporting is a compass for your marketing strategy. In this post, we’ll show you how to make sense of your reports and use that data to make smarter, more impactful marketing decisions.
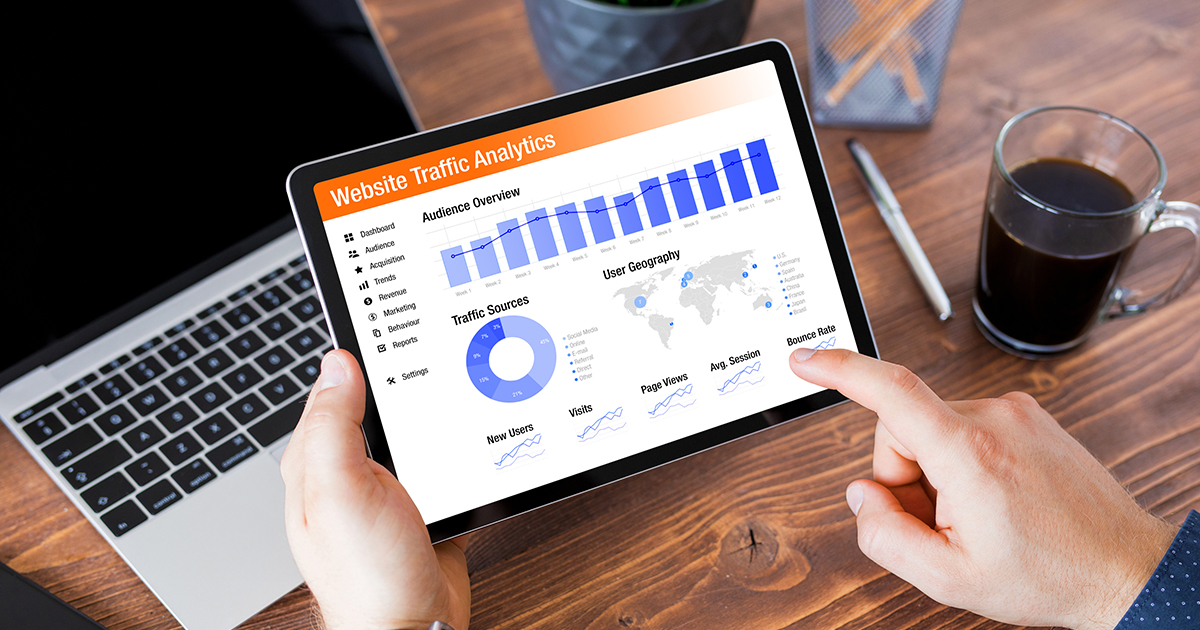
What Is Website Reporting?
Website reporting is the practice of reviewing and analyzing your online performance to uncover how visitors are finding and interacting with your site. These reports usually include:
- Keyword Rankings: Where your site shows up in search results
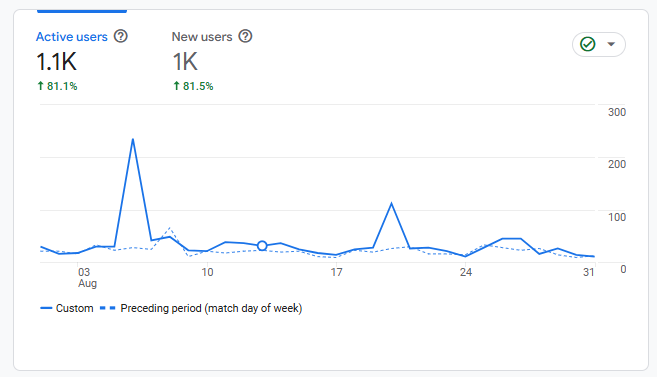
- Organic Traffic Trends: How many people are coming to your site through search engines
- Engagement Metrics: Bounce rate, pages per session, average session duration
- Conversions & Goal Tracking: What visitors are doing once they land on your site
- Referral Traffic: Where your visitors are coming from (Google, social media, backlinks, etc.)
- Backlink Performance: The quality and quantity of external links pointing to your site
It’s all about turning numbers into narratives. Data without context is just noise but with the right interpretation, it can become a powerful tool for growth.
Key Metrics to Guide Strategy
Not all metrics are created equal. Here are some of the most useful ones for adjusting your strategy:
1. Organic Traffic Growth
This is often the clearest signal that your SEO efforts are paying off. Increases here mean more people are finding you through search engines which typically leads to better-qualified leads.
2. Keyword Movement
Which terms are climbing in search rankings? Which ones are stuck or slipping? By tracking keyword performance over time, you can decide which terms to double down on and which to revisit with new content.
3. Bounce Rate and Engagement
If users land on your site and leave quickly, that’s a red flag. A high bounce rate on a key landing page might mean your message isn’t connecting or your content isn’t what users expected.
4. Conversion Funnels
If you’ve set up goal tracking, you can see how users progress from landing pages to form fills, downloads, or purchases. If traffic is up but conversions are flat, you’ve got a gap in the funnel that needs attention.
5. Traffic Sources
Where are people coming from? Organic search, direct traffic, paid ads, social? Knowing what channels are performing best can guide how you allocate your marketing budget.
What to Do With Red Flags
Even a “bad” report is useful—if you know what to look for. Here are a few common warning signs and what to do about them:
- Flatlining traffic: Look for technical SEO issues or outdated content.
- Drop in rankings: Revisit your content quality and page optimization for the affected keywords.
- High bounce rates: Consider user intent. Does your content match what people are actually searching for?
- Pages with traffic but no conversions: Add stronger CTAs or improve form visibility.
- Lost backlinks: Use a tool to monitor link decay and reach out for updated links or replacements.
From Insight to Action
Once you’ve identified your top-performing (and underperforming) pages, here’s how to put that insight into action:
- Optimize what’s working: Add internal links, refresh the content, or add lead magnets to your best-performing pages.
- Repurpose high-performing topics: Use strong blogs or pages as a base for emails, social posts, or new formats like video.
- Plug content gaps: If you’re ranking for certain terms but missing others, create content to fill the void.
- Test layout and copy changes: Small updates to headlines, CTAs, or page layout can have a big impact on conversions.
How Often Should You Review Website Reporting?
At a minimum, review your website performance monthly. This allows you to catch trends early without overreacting to normal fluctuations. Quarterly reviews can help spot seasonal trends, while year-over-year comparisons are great for understanding long-term growth.
If you work with an SEO or marketing agency, ask for reports that not only share the data but interpret it. You should come away from each report with a clear sense of what’s happening and what’s next.
Your Marketing Strategy Deserves Better Data
Think of website reporting like a GPS. Without it, you’re just guessing which direction to take. With it, you’re empowered to make strategic decisions based on real behavior, not hunches.
Whether you’re tracking new keywords, measuring the impact of a content campaign, or trying to improve your conversions, the right insights can guide your next move and your next new customer win.
Want to Get More Out of Your Reports?
Let’s take a deeper look together. We’ll show you how to transform your website performance data into a roadmap for business growth. Sign up for a free report analysis.